NexusGrid
Geospatial digital twin for modern energy systems and distributed energy resources.
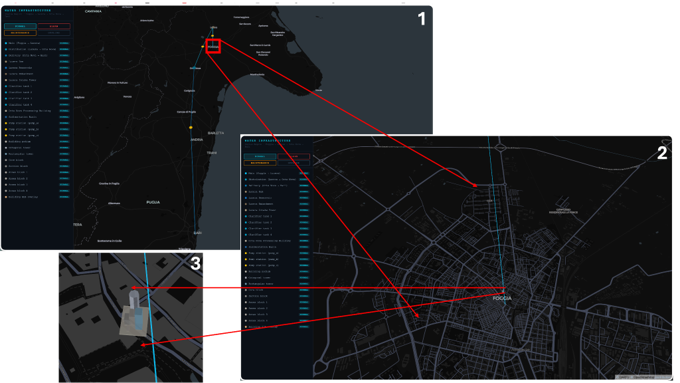
NexusGrid delivers a geospatial digital twin for modern energy systems through a multi-layered GIS platform. It unifies spatial, operational, environmental, asset-performance and compliance-related data within an interactive digital environment — where grid infrastructure, energy assets, distributed energy resources (DERs) and operational sites are represented as intelligent digital objects, each connected to metadata, evidence trails and analytics outputs.
NexusGrid is a sector-specific specialisation of NexusAtlas, inheriting its multi-layered GIS architecture and 3D rendering capabilities while adding energy-domain data models, asset-performance analytics, and compliance evidence workflows. It connects to NexusFlow for autonomous analytics and to NexusEarth for satellite-derived environmental intelligence — creating an integrated operational picture from substation level to landscape scale.
Key Features
- Multi-layered GIS with spatial, operational, and environmental layers in a unified energy-domain view
- Intelligent digital objects for grid assets, DERs, substations, and operational sites — each linked to live data, metadata, and evidence
- Asset-performance analytics and compliance evidence linking for regulatory and audit readiness
- Scenario modelling and what-if analysis for grid planning, capacity expansion, and contingency assessment
- NexusFlow integration for autonomous analytics, demand forecasting, and automated reporting
- Interactive 3D rendering of infrastructure, operational zones, and terrain context
Application Areas
Grid Operations
- Transmission and distribution grid operations
- Distributed energy resource (DER) integration and management
- Renewable energy site planning and monitoring
Governance & Resilience
- Compliance, audit, and regulatory evidence management
- Energy infrastructure resilience and climate-risk assessment
- Investment planning with geospatial cost-benefit analysis
Technical Specification
| Architecture | Multi-layered GIS with 3D rendering engine |
| Data Model | Asset-centric digital objects with linked metadata and evidence |
| AI Integration | Native NexusFlow hooks for analytics and automation |
| Compute | GPU acceleration for geospatial and 3D processing |
| Interfaces | Web GIS, APIs, exportable layers (OGC-aligned) |
| Cluster | Cluster 5 — Climate, Energy & Mobility |
How It Works
Intelligent Digital Objects
Every energy asset in NexusGrid — a transformer, a wind turbine, a solar array, a battery storage unit, a substation — exists as an intelligent digital object rather than a static map marker. Each object carries its own data context: technical specifications, operational status, maintenance history, sensor feeds, performance metrics, and linked compliance documents. Clicking a substation on the map doesn’t just show its location; it opens a live operational profile with load curves, fault history, connected feeders, and upcoming maintenance schedules. This object-centric model means the digital twin is not just a visualisation — it is an operational interface to the grid itself.
Multi-Layered Operational View
NexusGrid organises grid intelligence into composable layers that operators toggle and combine. The spatial layer shows grid topology — lines, substations, connection points, and coverage areas. The operational layer overlays real-time status — load levels, voltage profiles, fault indicators, and switching states. The environmental layer adds weather, terrain, flood zones, and climate-risk data from NexusEarth. The compliance layer highlights regulatory boundaries, inspection schedules, and evidence gaps. By combining layers, an operator can instantly see, for example, which substations in a flood-risk zone have overdue inspections and are currently running above 80% capacity.
Scenario Modelling
Energy planning requires understanding what happens under conditions that don’t yet exist. NexusGrid’s scenario modelling engine lets planners ask “what if” questions directly on the digital twin: what if we add 50 MW of solar in this region — where does the grid constrain? What if a key transformer fails during peak summer demand — which feeders are at risk? What if EV charging adoption doubles in this district by 2030 — where do we need reinforcement? Each scenario runs against the live grid model, producing spatially explicit impact assessments that show not just whether a problem occurs but exactly where, when, and how severely.
DER Integration
The energy transition is fundamentally about distributed resources — rooftop solar, battery storage, EV chargers, heat pumps, demand response — connecting to grids that were designed for centralised, one-directional power flow. NexusGrid makes DERs first-class digital objects: each unit is geolocated, characterised, and monitored within the digital twin. Aggregated views show DER penetration by feeder, by substation, by region. Forecasting models predict generation and demand patterns. And scenario modelling quantifies the hosting capacity of each part of the network — telling planners where new DERs can connect without costly reinforcement and where constraints are binding.
Compliance & Evidence
Energy infrastructure operates under dense regulatory frameworks — safety inspections, environmental permits, grid codes, market rules, and reporting obligations. NexusGrid links compliance requirements directly to the assets they apply to: each digital object carries its compliance status, upcoming deadlines, linked evidence documents, and audit history. When a regulator asks “show me the inspection records for all substations in Region X”, the answer is a filtered view and an exportable evidence pack — not a manual search through filing cabinets. This compliance-as-data approach reduces regulatory risk and transforms audit preparation from a project into a query.
From NexusAtlas to NexusGrid
NexusGrid shares its core architecture with NexusAtlas — the same multi-layered GIS engine, the same 3D rendering pipeline, the same digital-object data model. What NexusGrid adds is energy-domain specificity:
- Grid topology modelling — feeders, buses, transformers, switches, and their electrical relationships
- Energy-specific data connectors — smart meter telemetry, SCADA feeds, market data, weather-to-generation models
- Power-flow-aware scenario modelling — what-if analysis that respects electrical constraints, not just spatial ones
- DER characterisation — generation profiles, storage state-of-charge, demand-response availability
- Regulatory layer — compliance templates, inspection workflows, and evidence management aligned to energy-sector obligations
This means that organisations already using NexusAtlas for environmental monitoring can extend into energy infrastructure management without a separate platform — the same operational staff, the same interface paradigm, with additional energy-domain capabilities layered on top.
Heritage & Lineage
NexusGrid is a sector-specific specialisation of the NexusAtlas digital-twin platform, which originated in the SILVANUS project (H2020, GA 101037247) for climate-resilient forest management. The geospatial architecture, 3D rendering engine, and digital-object data model were proven in environmental monitoring and then adapted for the energy sector — adding grid topology, DER management, and regulatory compliance capabilities. VTG’s work on the DEFENDER project (critical energy infrastructure protection) further informed the security and resilience dimensions of the platform.
Target Calls: Horizon Europe Cluster 5 (Climate, Energy and Mobility) — smart grids, DER integration, energy infrastructure resilience, and clean energy transition topics.
Interested in NexusGrid?
Contact us to discuss how NexusGrid can provide a geospatial digital twin for your energy infrastructure.
Book a Call →